Thermal measurements are used in a variety of applications involving LEDs, laser diodes and VCSELs. The measurements utilize the Electrical Test Method (ETM), and they fall in to two broad categories: measurements of the device’s junction temperature, and determination of thermal resistance including measurements of the thermal path from the junction to an exterior point. These thermal measurements are used by solid-state device scientists to understand and improve devices, by test engineers when making optical measurements, and by luminaire / fixture designers to understand the thermal performance of lighting products.
SpikeSafe Pulsed SMU
The SpikeSafe SMU supports all these measurements, from simple Tj assessment to complex thermal analysis using structure functions. The SMU powers the LED or laser during thermal measurements using its primary and bias current sources, and its digitizer records the forward-voltage (VF) readings needed to calculate temperature. This voltage data is then processed by external software to complete the desired measurement.
The supported LED and laser thermal measurements include:
- In-situ Tj for individual LEDs or luminaires
- Tj change during photometric measurements
- Tj rise during pulsed operation
- Thermal resistance
- Heat path analysis using structure functions
Each measurement is explained in more detail below. Vektrex-supplied components for the specific application are described.
Custom software (see Python examples) may also be used to make automated thermal measurements using the SpikeSafe SMU.
In-situ Tj Measurement for Individual LEDs or Luminaires
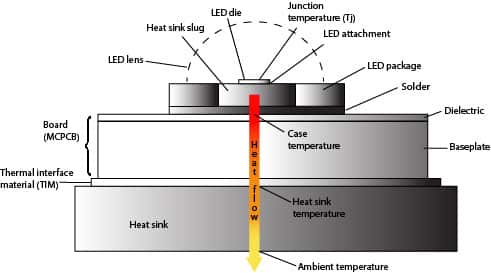
The Junction Temperature (Tj) is the operating temperature of the LED or laser diode’s semiconductor junction. When operating, the Tj of a semiconductor is higher than the surrounding ambient environment, and the heat dissipated in the semiconductor flows through a path that includes the various packaging components such as solder, MCPCB, and heat sink. This is illustrated in the diagram below.
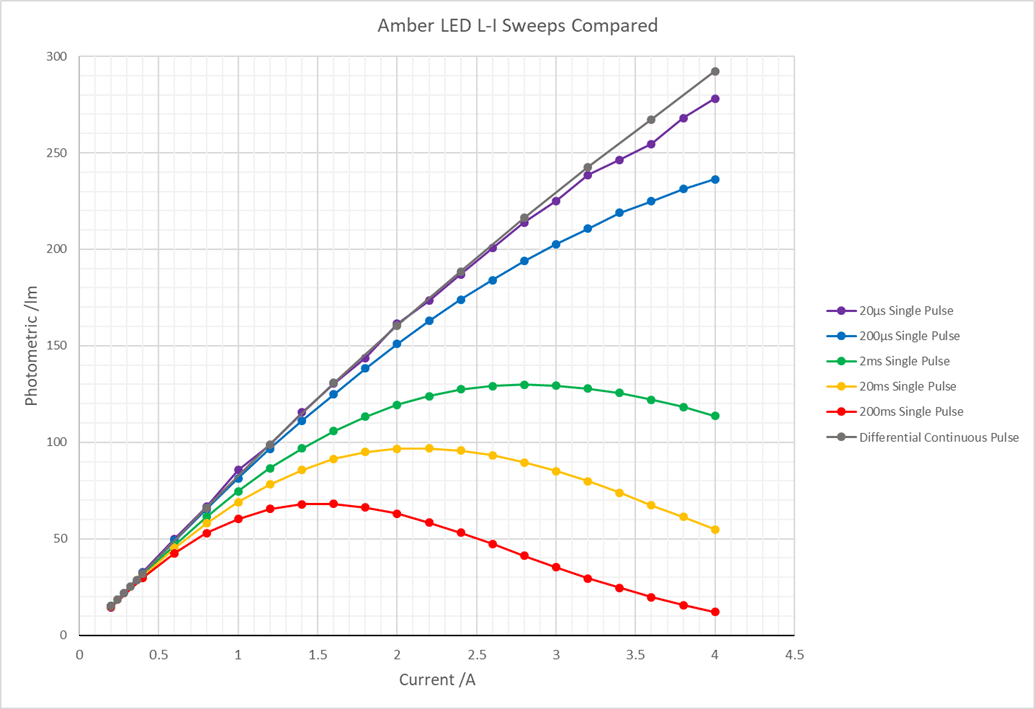
Tj has a direct impact on the long-term reliability of a laser or LED. Higher in-situ Tj leads to reduced long-term reliability. At temperatures above 150 ˚C the device may fail immediately. Tj also impacts the operating characteristics of LEDs and lasers. For example, an amber LED’s light output decreases dramatically as junction temperature increases.
LED manufacturers typically provide performance specifications at a specific Tj along with derating factors that allow performance at other temperatures to be calculated. Using these values, along with actual in-situ measurements, product designers verify the product will perform within its advertised specifications.
The in-situ junction temperature is the Tj of the device (e.g., an LED) in its operating environment. For example, the operating environment might be a burn-in fixture, an enclosed luminaire, or any other environment where the device is installed.
In-situ Tj can be measured in two ways: directly, with the Electrical Test Method (ETM); or indirectly using the estimated thermal resistance of the heat path. Estimating Tj via thermal resistance can be risky though – if the actual Tj is incorrect, the product could fail, perform poorly, or it might be overdesigned and more costly than it needs to be.
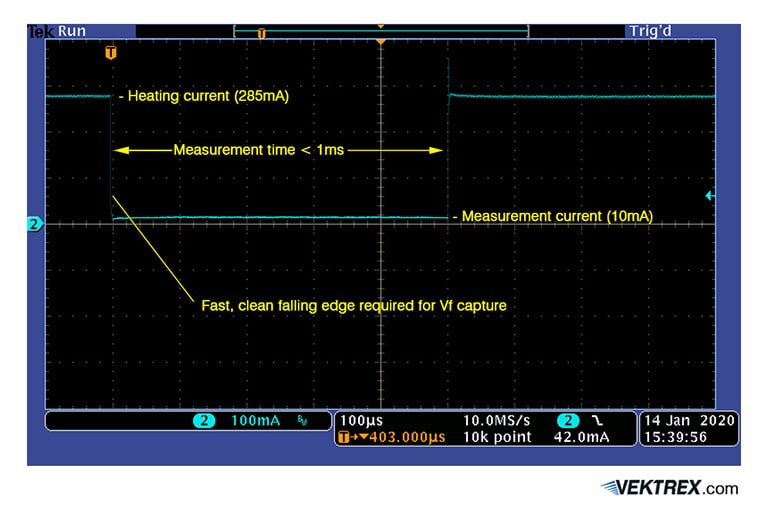
The ETM method relies on a high-duty-cycle heating current and fast transition to measurement current. A typical In-Situ LED junction temperature current waveform when using the ETM shows this fast transition.
There are many reasons to undertake in-situ Tj measurements. For example:
- Mass-marketed lighting products must include heat sinks for cooling. With more accurate Tjmeasurements, thermal resistance uncertainty budgets can be reduced, allowing heat sinks to made smaller. This reduces product cost and shipping cost.
- Many product failures can be traced to excessive junction temperatures or to large swings in the junction temperature. Warranty losses related to a Tj design error can exceed several hundred thousand dollars for a high-volume product.
- For products used in designs that are produced over many years, knowledge of the accurate Tj is helpful when comparing replacement devices to the original LED or laser.
- For manufacturers of LEDs and lasers, it is important to provide the most accurate measurement data possible. This data should include the precise Tj at the time of measurement.
- In-situ Tj measurement is a useful tool for qualifying and adjusting a design for ideal performance as it will expose the effect of small changes in the product. For example, the impact of various thermal interface materials on the heat flow out of a COB package can be measured quantitatively in just a few minutes.
- In-situ Tj should be compared with the manufacturer’s maximum allowed junction temperature to make sure it is below the maximum allowable Tj. Usually, designers want to see Tj 20-40% below this temperature. This is particularly important for pulsed overdrive operation.
Vektrex Components Supplied for In-Situ TJ Measurement:
Vektrex SMU
Vektrex SMU Bias option (integrated low current measurement source)
Vektrex TJ Measurement software (enhanced Control Panel) uploads data and performs y-intercept calculations
Vektrex TJ Measurement Instruction Guide
Vektrex Tj Utility workbook (MSExcel) to calculate k-factor and Tj
Tj Change During Photometric Measurements
An LED or laser heats during photometric measurements and thus the junction temperature increases. The increased Tj alters the measurement, reducing accuracy. In high-power situations, the measurement may be useless. Photometric measurement standards, such as the Illuminating Engineering Society’s LM-85, require Tj shift to be assessed and accounted for, either by altering the testing temperature, or by applying a correction to the measurement. LM-85 provides two different methods in its annexes for assessing Tj during measurements. One uses only the primary current source and the other uses both the primary and a secondary bias source.
Tools to assess Tj change during photometric measurements:
Vektrex SMU
Vektrex SMU Bias option (integrated low current measurement source)
Vektrex TJ Measurement software (enhanced Control Panel) uploads data and performs y-intercept calculations
Vektrex TJ Measurement Instruction Guide
Vektrex Tj Utility workbook (MSExcel) to calculate k-factor and Tj
Pulsed Operation Tj Rise Assessment
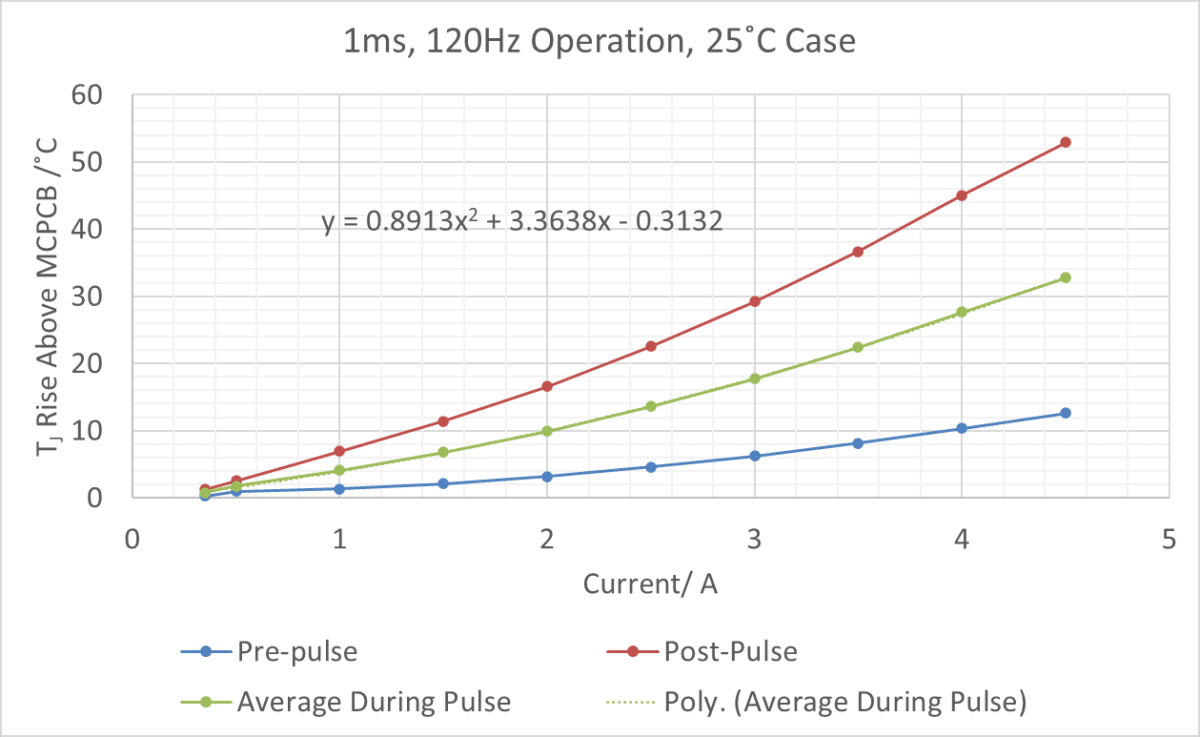
An LED or laser being operated with pulsed drive will experience both average and transitory heating. When designing luminaires, it is useful to know the average Tj during pulsed operation, and also the peak Tj. Average Tj can be compared with data sheet Tj values when looking at characteristics such as optical power output and wavelength. Peak Tj should be measured to ensure the device is well below the maximum allowed Tj. As discussed in the previous section, the IES LM-85 document includes procedures in its annexes for assessing Tj.
This graph shows LED Tj for 1ms, 120Hz pulsed operation of a red LED. The pre-pulse, post-pulse and average temperature are shown, along with a polynomial model derived from the average Tj plot.
Tools needed to assess Tj rise during pulsed operation:
Vektrex SMU
Vektrex SMU Bias option (integrated low current measurement source)
Vektrex TJ Measurement software (enhanced Control Panel) uploads data and performs y-intercept calculations
Vektrex TJ Measurement Instruction Guide
Vektrex Tj Utility workbook (MSExcel) to calculate k-factor and Tj
Thermal Resistance Measurement
Thermal resistance is a parameter that quantifies the resistance heat sees when flowing through a path. It is always expressed as the resistance from one point to another (e.g., from junction to ambient air). The typical units are ˚C/W. LED and laser manufacturers typically provide the thermal resistance for the device itself – that is the resistance from junction to case. However, this does not include the resistance of other structures such as printed circuit boards and heat sinks. In many design situations, such as luminaire design, knowing the thermal resistance of these structures is very useful.
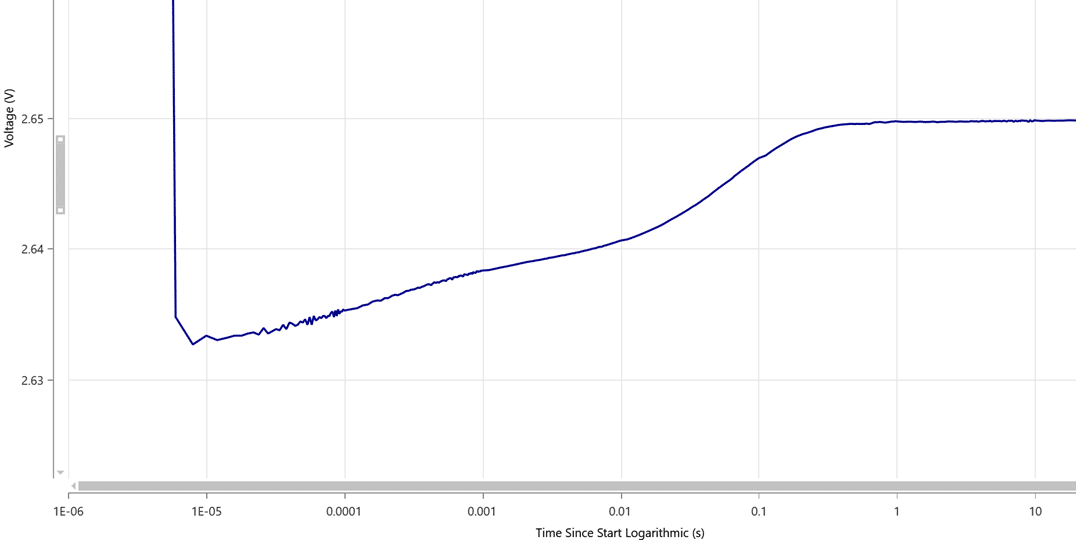
The JEDEC JESD51-14 Transient Dual Interface Method is the best way to measure thermal resistance. This method requires a two-level current source and a voltage digitizer that can sample for long time periods. The LED or laser’s voltage is sampled after a transition and the resulting cooling curve is analyzed to calculate the thermal resistance. JEDEC provides a free software tool that does this; the SpikeSafe Control Panel application captures the data and outputs it in a file format compatible with the JEDEC tool.
Tools to measure thermal resistance:
Vektrex SMU
Vektrex SMU Bias option (integrated low current measurement source)
Vektrex Thermal Resistance Software (Enhanced Control Panel) to output logarithmically spaced sample data.
JEDEC software to generate structure functions and calculate thermal resistance.
Heat Path Analysis
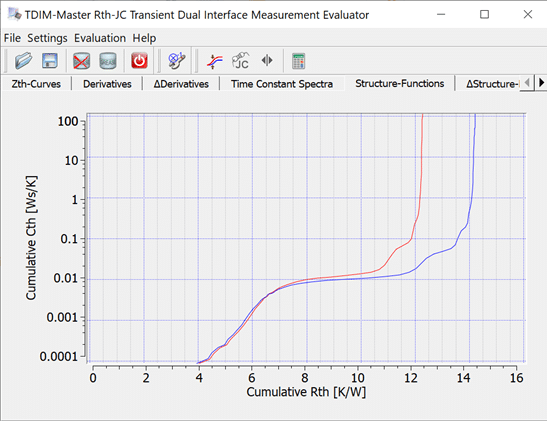
Heat path analysis is similar to thermal resistance measurement, but instead of a bulk parameter representing the entire heat path, the focus of the measurement is usually a specific structure, such as the die attachment or the thermal interface material. To allow the different materials in the heat path to be identified, the cooling curve is transformed into a network model called a structure function. Structure functions for two different conditions can then be compared and the thermal characteristics of the material of interest can be inferred. The special-purpose tool that popularized structure function analysis is called the T3Ster, produced by MICRED.
The calculations that the T3Ster uses to transform a cooling curve into a structure function were placed in the public domain by MICRED and JEDEC in 2010 in the form of a free analysis tool, TDIM Master. However, most labs found it was difficult to obtain cooling curves with sufficient resolution using the general-purpose instrumentation available at the time, because voltage readings were noisy. In addition, the need to change sampling intervals during the cooling time required custom software to implement logarithmic sampling. Often repetitive captures were required, meaning a single measurement could take more than an hour. Combining the captured data was also difficult.
With the addition of logarithmic sampling to its true-differential digitizer, an accurate cooling curve can be collected in seconds with the SpikeSafe SMU with no custom programming. The SMU’s digitizer provides sub-millivolt detail, and it collects the curve in one capture, automatically altering its boxcar averaging on-the-fly. The log sampling feature is available in every SMU model from 500mA to 60A. The SpikeSafe Control Panel application uploads the captured log data and outputs it in a file format compatible with the JEDEC tool. Using the JEDEC tool, structure functions can then be obtained with just a few clicks after importing the Control Panel data.
Tools needed for heat path analysis:
Vektrex SMU
Vektrex SMU Bias option (integrated low current measurement source)
Vektrex Thermal Resistance Software (Enhanced Control Panel) to output logarithmically spaced sample data.
JEDEC software to generate structure functions and calculate thermal resistance.
Products for Junction Temperature Measurements
JD-2020 – The JD-2020 LED Thermal Resistance Analyzer is a high-speed instrument designed to conduct transient/in-line thermal resistance (RΘ) measurements.
MICRED T3STER – The MicReD T3Ster specializes in highly-detailed, fast, accurate thermal testing, measurement, and characterization of IC packages, LEDs, and systems.