Devices such as lasers and LEDs are characterized by plotting the forward current vs voltage for the device’s typical operating range – for example from 10% of maximum current to maximum current. The output data is used as input to marketing for development of datasheets. End use designers use this data sheet information to select and create designs around the devices. Unfortunately, present day I-V characterization – used to present the operating characteristic of an LED or laser – suffer from significant distortions due to device junction heating. These inaccuracies make it difficult for designers to match devices to optimal LED or laser drive circuity. The mismatch results in increased R&D costs and/or an end product with reduced overall energy efficiency.
Modern day source measure units that supply short precise current pulses enable true constant-temperature I-V plots to be generated quickly and easily. Multiple constant temperature plots may then be overlaid on a single graph to produce a much more useful plot that designers can use to optimize LED and laser designs.
Generating an I-V Characterization Plot
To generate an IV plot, devices are driven with a DC or pulsed current that increases in a stair-step fashion. Voltage measurements are made at each step. Typically, source-measure instruments or programmable power supplies are used to drive the devices.
Ideally, I-V plots are performed at a constant, specific junction temperature. But each current step produces some junction heating. As the current increases, the junction heats more and more. If the current steps are close together (as in a staircase sweep) the cumulative heating can be dozens of degrees C. Plots produced this way encompass three variables: I, V and T, not just I and V as shown on the axis. Such plots are impossible to relate to a specific operating point for the LED or laser; they can only be used as a partial guideline for a designer. Other information, such as graphs of voltage shift with junction temperature, must be used to estimate the device’s actual operating point.
To eliminate temperature as a variable, current pulses can be used rather than DC current steps. If the pulses are spaced far enough apart in time, the case temperature can be maintained at a constant temperature via heat transfer to the ambient environment or a temperature-controlled platform. The junction will still heat during each pulse however, so that later data points are still at a higher junction temperature than data points at the start of the plot.
To limit this pulse-heating effect, short pulses must be used. For most LEDs, this means pulses of roughly 20µs to 100µs in length. Lasers may require even shorter pulses. Typical bench power supplies cannot pulse fast enough to produce microsecond pulses. The fastest source-measure devices advertise pulses in the 50µs -100µs range, but often these devices have slow rise times or overshoot that increase the pulse heating effect and make it difficult to make an accurate Vf measurement at the top of the pulse.
Pulse Settling Time 500mA Current Pulse Driving a 833nm IR Laser :
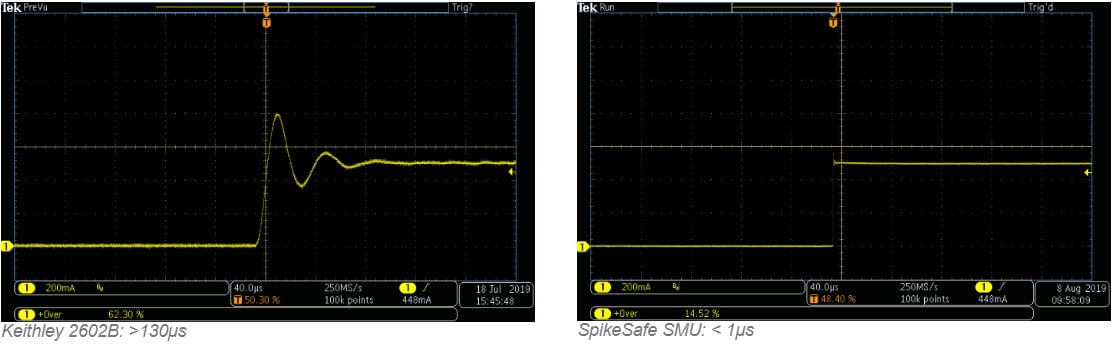
Short pulses also transfer little energy to the part so heat removal during the sweep is less of an issue. Sweeps using very short pulses may eliminate need for a thermal platform Traditional single pulse I-V sweeps employ pulses of many milliseconds that must be spaced 1 second or more apart in time to allow the thermal control system to cool the device between pulses. Sweeps done this way may take many seconds or minutes to complete. With short pulses, current steps may be placed closer together in time, speeding the test. A more accurate sweep is completed in milliseconds.
Using a SpikeSafe SMU and the Vektrex developed Control Panel Software application, it is easy to produce IV curves for device characterization.
Using Short Pulse Widths
Shorter pulse widths produce less heating, but how short is short enough? To estimate heating, determine the K-factor and capture the Vf waveform. Examine the forward voltage across the top of the pulse. Use this information to estimate the amount of heating from the beginning of the pulse to the measurement point. For the 20us measurements above, the Vf is measured just after the voltage transient at the beginning of the pulse. At 1A, the Vf measured is approximately 3.184V as shown below. This is within a millivolt or two of Vf(0), the theoretical Vf at the point of turn-on. For longer pulses, Vf declines in an exponential curve. For 20ms pulsing (the pulse width used by the LED manufacturer to characterize these parts) the Vf declines to 3.139V. The K-factor for this LED at 1A is 2.5mV/ºC. The temperature rise for the longer pulse (20ms) can then be estimated as:
Trise = (3.184V – 3.139V) / 2.5mV/C = 18C
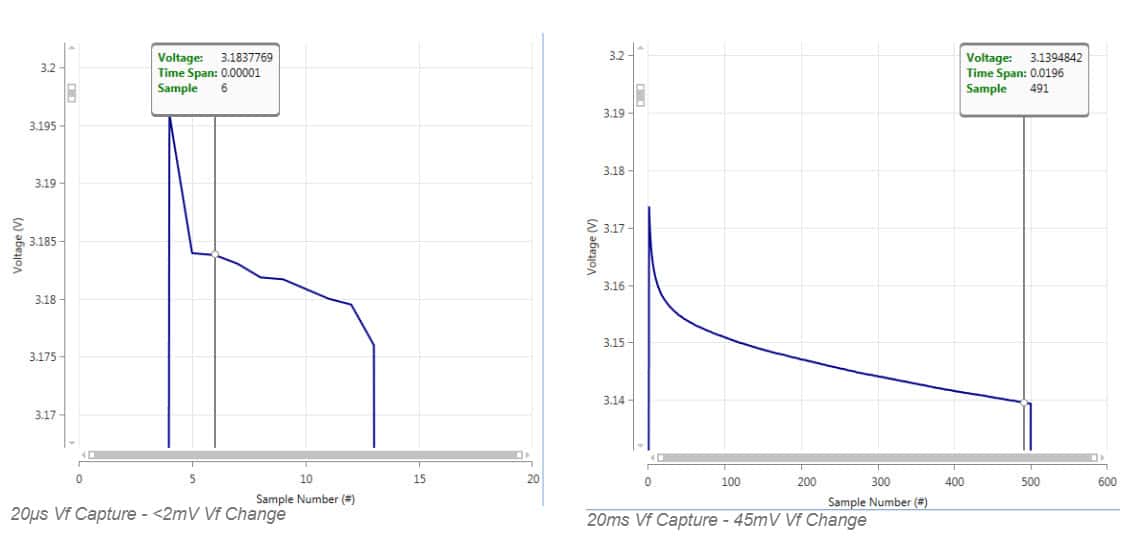
From the Vf captures above, the true Vf reading associated with the short 20us pulse is much closer to the Vf(0) than the longer 20ms pulse.
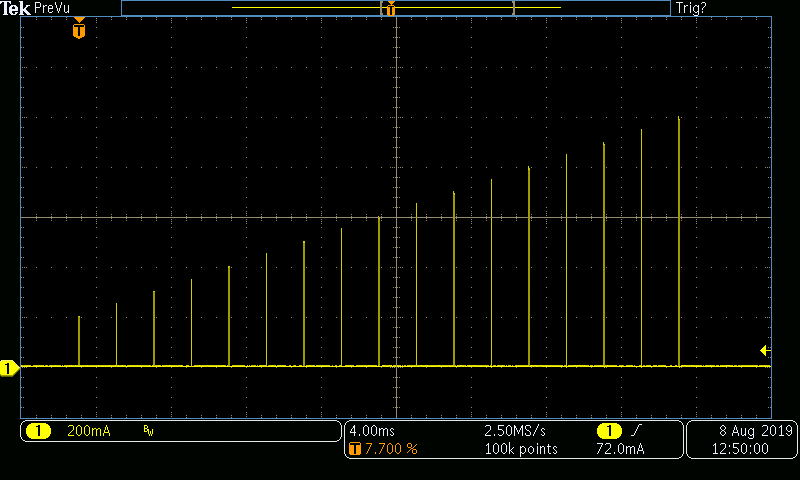
Precision Pulsed Sweep to Generate An I-V Plot
A fast pulse sweep used to generate an I-V plot is shown below.
Improved, Multi-Curve Plots Show Complete Picture
Using the technique described here a single I-V plot can be generated in less than a second. This plot is accurate for a specific junction temperature, for example 25C. While a single temperature plot is useful, designers report other information (such as an estimate of the K-factor) to determine operating point. As end-product designers may be operating at a variety of junction temperatures, a better choice is to plot multiple I-V curves on a single graph. This is the typical practice with other diode types such as rectifier diodes.
A multi-curve plot for the royal blue LED in this application note is shown below. Along with the constant junction temperature plots, the graph shows the manufacturer’s datasheet curve, and a curve generated with the manufacturer’s test conditions: 20ms pulses at 1s intervals.
The plot shows that the datasheet curve does not match the any of the constant junction temperature curves. This is to be expected since the 20ms pulses used to generate the datasheet curve result in 18 ºC of heating at 1.05A. The surprising result is that the datasheet curve does not match the 20ms curve either. Even if the datasheet curve is adjusted to begin at the same point as the 20ms curve, the curves don’t match. The greater slope of the datasheet curve indicates the device under test is experiencing greater heating during the test. The amount of heating can be estimated by viewing the constant temperature curves. The 20ms curve bends 18 ºC, as calculated, and the corrected datasheet curve bends more than double that. Therefore, the junction temperature is about 125 ºC for the 1.05A measurement – 40 ºC above the intended test temperature.
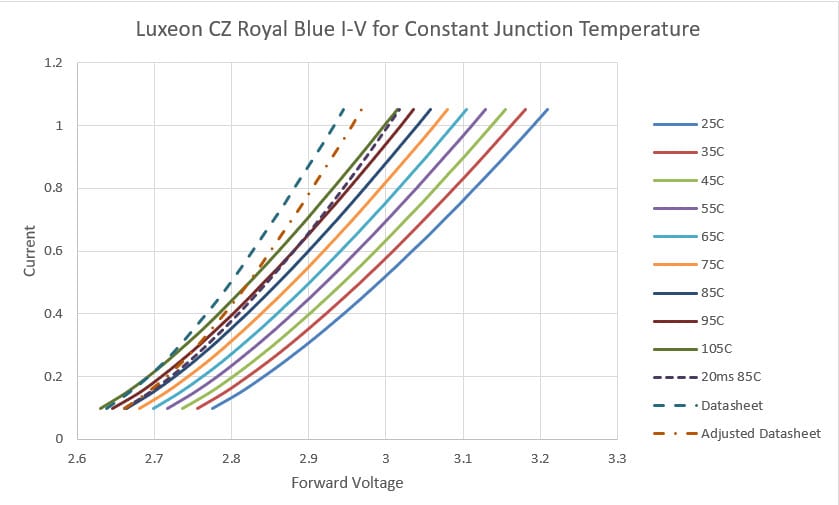
Multi-Curve I-V Plot Makes it Easy to Determine Device Operating Point
Conclusion: Use Short Precise Pulses To Improve I-V Plots
LED and laser manufacturers presently supply a single I-V plot. This plot is usually specified at a constant junction temperature, but in fact, the temperature is changing significantly during the test, and so the resulting plots are distorted. The situation results from limitations in the current and voltage sources that are used for these tests.
For example, for the LED tested, the junction temperature for the final data point was high by 40 ºC. This caused the voltage data to be off by 4.4%, meaning a lighting design based upon the incorrect datasheet value would have to operate at a point 4.4% away from nominal. Worst-case the product could consume 4.4% more power than predicted.
By using modern, precision pulsed current sources, highly accurate plots can be generated in as little as 34ms. To make this matching easier, manufacturers should shift from a single series plot to multi-series plot.
By improving I-V data, lighting designers can more accurately match drive circuitry to the LED or laser load. Better matching improves conversion efficiency and end-product reliability.
Using a SpikeSafe SMU and the Vektrex developed Control Panel Software application, it is easy to produce IV curves for device characterization.
Contact Vektrex to purchase your own modern SpikeSafe SMU and improve your IV characterization.