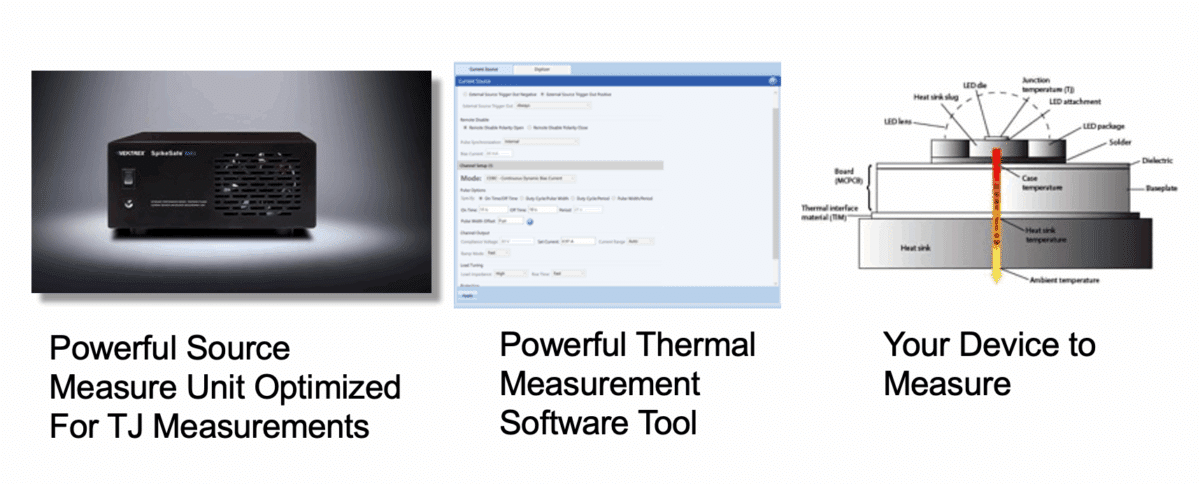
Thermal Measurements are key for semiconductor device manufacturers and designers integrating semiconductor devices into end-user applications. Vektrex offers complete turnkey thermal measurement systems based upon the powerful DC Pulsed Source Measure Instruments.
Use Forward Voltage to Determine Junction Temperature
Key to thermal measurements are accurate forward voltage (Vf) measurements. Vektrex Source Measure Instruments integrate a low noise differential digitizer with 18-bit resolution. As a result, forward voltage can easily be used to determine junction temperature when using Vektrex SMU and the powerful thermal measurement software tool. This method does not require the secondary measurement source.
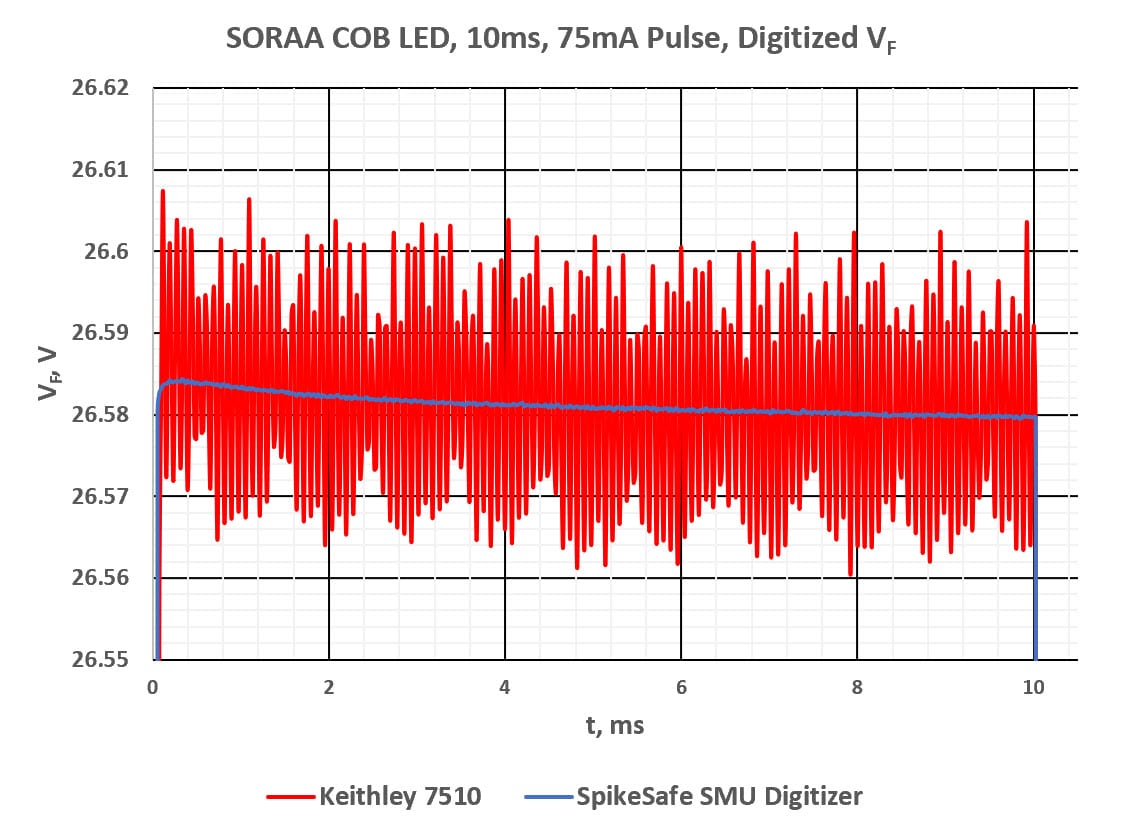
Fully-balanced, true-differential digitizer performs low-noise measurements. The digitizer’s superior noise performance enables clear identification of thermal trends.
The 4 mV forward voltage change (see blue line in the image) equates to a 0.25 ºC increase in junction temperature.
A 0.25 ºC increase in junction temperature reduce flux output and directly impacts device reliability.
Required for Forward Voltage Measurement:
- Vektrex SMU or SMU High Current provides the power of two instruments in one (DC/Pulsed source and Digitizer for accurate Vf).
- Vektrex Thermal Measurement Software for Junction Temperature and Thermal Resistance with Instruction Guide.
- Cable connection to your device.
- Thermal platform (optional).
- Method to measure or estimate temperature for K-Factor calibration.
Use Electrical Test Method to Determine Junction Temperature
The Electrical Test Method uses the inherent voltage-temperature relationship of a device to infer the junction temperature. The electrical test method is the most accurate method to determine junction temperature. As described in the JEDEC 51-14 standard, the electrical test method relies on two current sources; one for heating and the other for measurement. Therefore, Vektrex offers the option to include a secondary measurement source called the BIAS source when configuring your pulsed/DC SMU instrument.
Optimized for thermal measurement applications that demand tightly coupled sources and measurement, Vektrex SMU used for junction temperature measurement based upon the JEDEC Electrical Test Method integrates two highly stable current sources and a single true differential digitizer into one instrument. The two current sources work in tandem to measure Vf at heating and cooling currents with a transition time <50us. Furthermore, the true differential digitizer provides extremely precise measurement capabilities with detection of mV changes — important when measuring junction temperature. This is a compact, single channel, DC and pulsed tester.
Manufacturers of LEDs and semiconductor devices, luminaires and end user modules for UV disinfection, semiconductor, automotive and medical industries will find SMU units invaluable for wide range of thermal measurement, characterization and production test applications.
Required for Thermal Measurements using the Electrical Test Method:
- Vektrex SMU or SMU High Current with secondary measurement source. Provides the power of three instruments in one (DC/Pulsed Source (heating), Secondary BIAS source (measurement) and differential digitizer (for accurate Vf)
- Vektrex Thermal Measurement Software for Junction Temperature, Thermal Resistance, and Heat Path Measurements with Instruction Guide.
- Cable connection to your device.
- Thermal Platform (recommended).
In-Situ Junction Temperature Measurements for Luminaire Manufacturers
Junction temperature has a direct impact on the long-term reliability of a laser or LED. Higher in-situ TJ reduces long-term reliability. Many companies mathematically determine or estimate the in-situ junction temperature of devices integrated into an end-user product. It is easy to quantitatively determine the LED/device junction temperature “in-situ” for the application using the appropriate Vektrex SMU or SMU High Current model.
- Reduce R&D cycles. The data on LED/device datasheets is not always accurate or complete enough for your application. With Vektrex thermal measurements validation is possible.
- The information gathered during characterization is useful for determining suitable warranties for the end-user product.
- Using the JEDEC Electrical Test method, the LED is being directly measured. LED/device manufacturers cannot argue with this data.
- LED manufacturers typically provide performance specifications at a specific Tj along with derating factors that allow performance at other temperatures to be calculated. Using these values, along with actual in-situ measurements, product designers verify the product will perform within its advertised specifications.
- Torque, heatsinks and thermal interface material may be determined.
- The characterization data may also be used in the future when existing LED/devices are obsoleted and/or replaced with better models.
Required for In-Situ Junction Temperature Measurement using the Electrical Test Method:
- Vektrex SMU or SMU High Current with secondary measurement source. Provides the power of three instruments in one (DC/Pulsed Source (heating), Secondary BIAS source (measurement) and differential digitizer (for accurate Vf).
- Vektrex Thermal Measurement Software for Junction Temperature, Thermal Resistance, and Heat Path Measurements with Instruction Guide.
- Cable connection to your device.
- Thermal Platform (recommended).